Monitoring SGX Memory
Overview
The cgroups-prometheus-exporter is responsible for monitoring and exposing
resource consumption based on Linux cgroup information.
Currently, it provides a solution to get the EPC usage exported
as a Prometheus metrics.
Exported Metrics for Cgroups Prometheus Exporter
The cgroups-prometheus-exporter exports the following metrics:
| Metric Name | Description | Type | Labels |
|---|---|---|---|
osc_cgroups_sgx_epc_used_bytes |
Represents the total amount of SGX EPC memory currently being used by the cgroup in bytes | Gauge | scope qos uid node namespace pod container |
osc_cgroups_sgx_epc_limit_bytes |
Represents the total limit of SGX EPC memory which can be used by the cgroup in bytes, if not set it will be 0 | Gauge | scope qos uid node namespace pod container |
osc_cgroups_memory_used_bytes |
Represents the total amount of main memory currently used by the cgroup in bytes | Gauge | scope qos uid node namespace pod container |
osc_cgroups_sgx_epc_events |
Represents the events of SGX EPC memory is reaching the limit | Gauge | scope qos uid node namespace pod container |
osc_cgroups_exporter_status |
Populated if cgroup directories or files cannot be processed | Gauge | msg path |
Explanation of the Metric Label Parameters
scope-
defines the scope
qos- Summarised value for the respective Kubernetes Quality of Service class.
pods- Summarised value for all pods running on the respective Kubernetes node.
pod- Value for an individual pod.
container- Value for an individual container.
qos- The QoS class of the respective pod/container.
uid- The unique identifier of the container or pod.
node- The name of the node on which the pod is deployed. This label helps to correlate the pod to the node.
msg- Type of processing error.
path- Path of the file where the processing problem occurred.
namespace- The namespace of the pod.
pod- The name of the pod.
container- The name of the container.
EPC memory consumption metrics
OscCgroupsSgxEpcUsedBytes and OscCgroupsSgxEpcLimitBytes
are Prometheus metrics exported by the exporter
so that the usage and limit of SGX EPC memory can be monitored
for each Quality of Service (QoS) level in a containerized environment.
OscCgroupsSgxEpcUsedBytes
This metric represents the amount of currently consumed SGX EPC memory
for different scopes (indicated by the scope label).
It is measured in bytes.
OscCgroupsSgxEpcLimitBytes
This metric represents the maximum limit of SGX EPC memory that a container can use. It is also measured in bytes.
Note
If no upper limit is defined, the metric is set to 0.
Example
Here's an example of how these metrics might appear in Prometheus:
# HELP OscCgroupsSgxEpcUsedBytes The amount of SGX EPC memory in bytes currently being used by a container.
# TYPE OscCgroupsSgxEpcUsedBytes gauge
OscCgroupsSgxEpcUsedBytes{scope="pod",qos="guaranteed",uid="abc123",node="sgxnode",container="",namespace="kube-system",pod=""} 1048576

# HELP OscCgroupsSgxEpcLimitBytes The maximum limit of SGX EPC memory in bytes that a container can use.
# TYPE OscCgroupsSgxEpcLimitBytes gauge
OscCgroupsSgxEpcLimitBytes{scope="pod",qos="guaranteed",uid="abc123",node="sgxnode",container="",namespace="kube-system",pod=""} 2097152
In this example, the pod with UID "abc123" is currently using 1 MiB of its allocated 2 MiB of SGX EPC memory.
OscCgroupsMemoryUsedBytes
The osc_cgroups_memory_used_bytes metric
reports main memory consumption value in bytes.
OscCgroupsSgxEpcEvents
The osc_cgroups_sgx_epc_events metric reports epc memory paging events.
OscCgroupsExporterStatus
The osc_cgroups_exporter_status metric reports a failure to process
any of the supported memory files,
indicating that there is a problem
with accessing the cgroups directory or reading.
The OscCgroupsExporterStatus metric is filled with the provided error message
and the path to the failed file.
If an error occurs,
the gauge status is set to 1.
Otherwise, the value for a specific directory is 0.
This metric is used for our Prometheus Alerts.
Examples of published Metrics with different Scopes
- metric
osc_cgroups_memory_used_bytes, scopepod: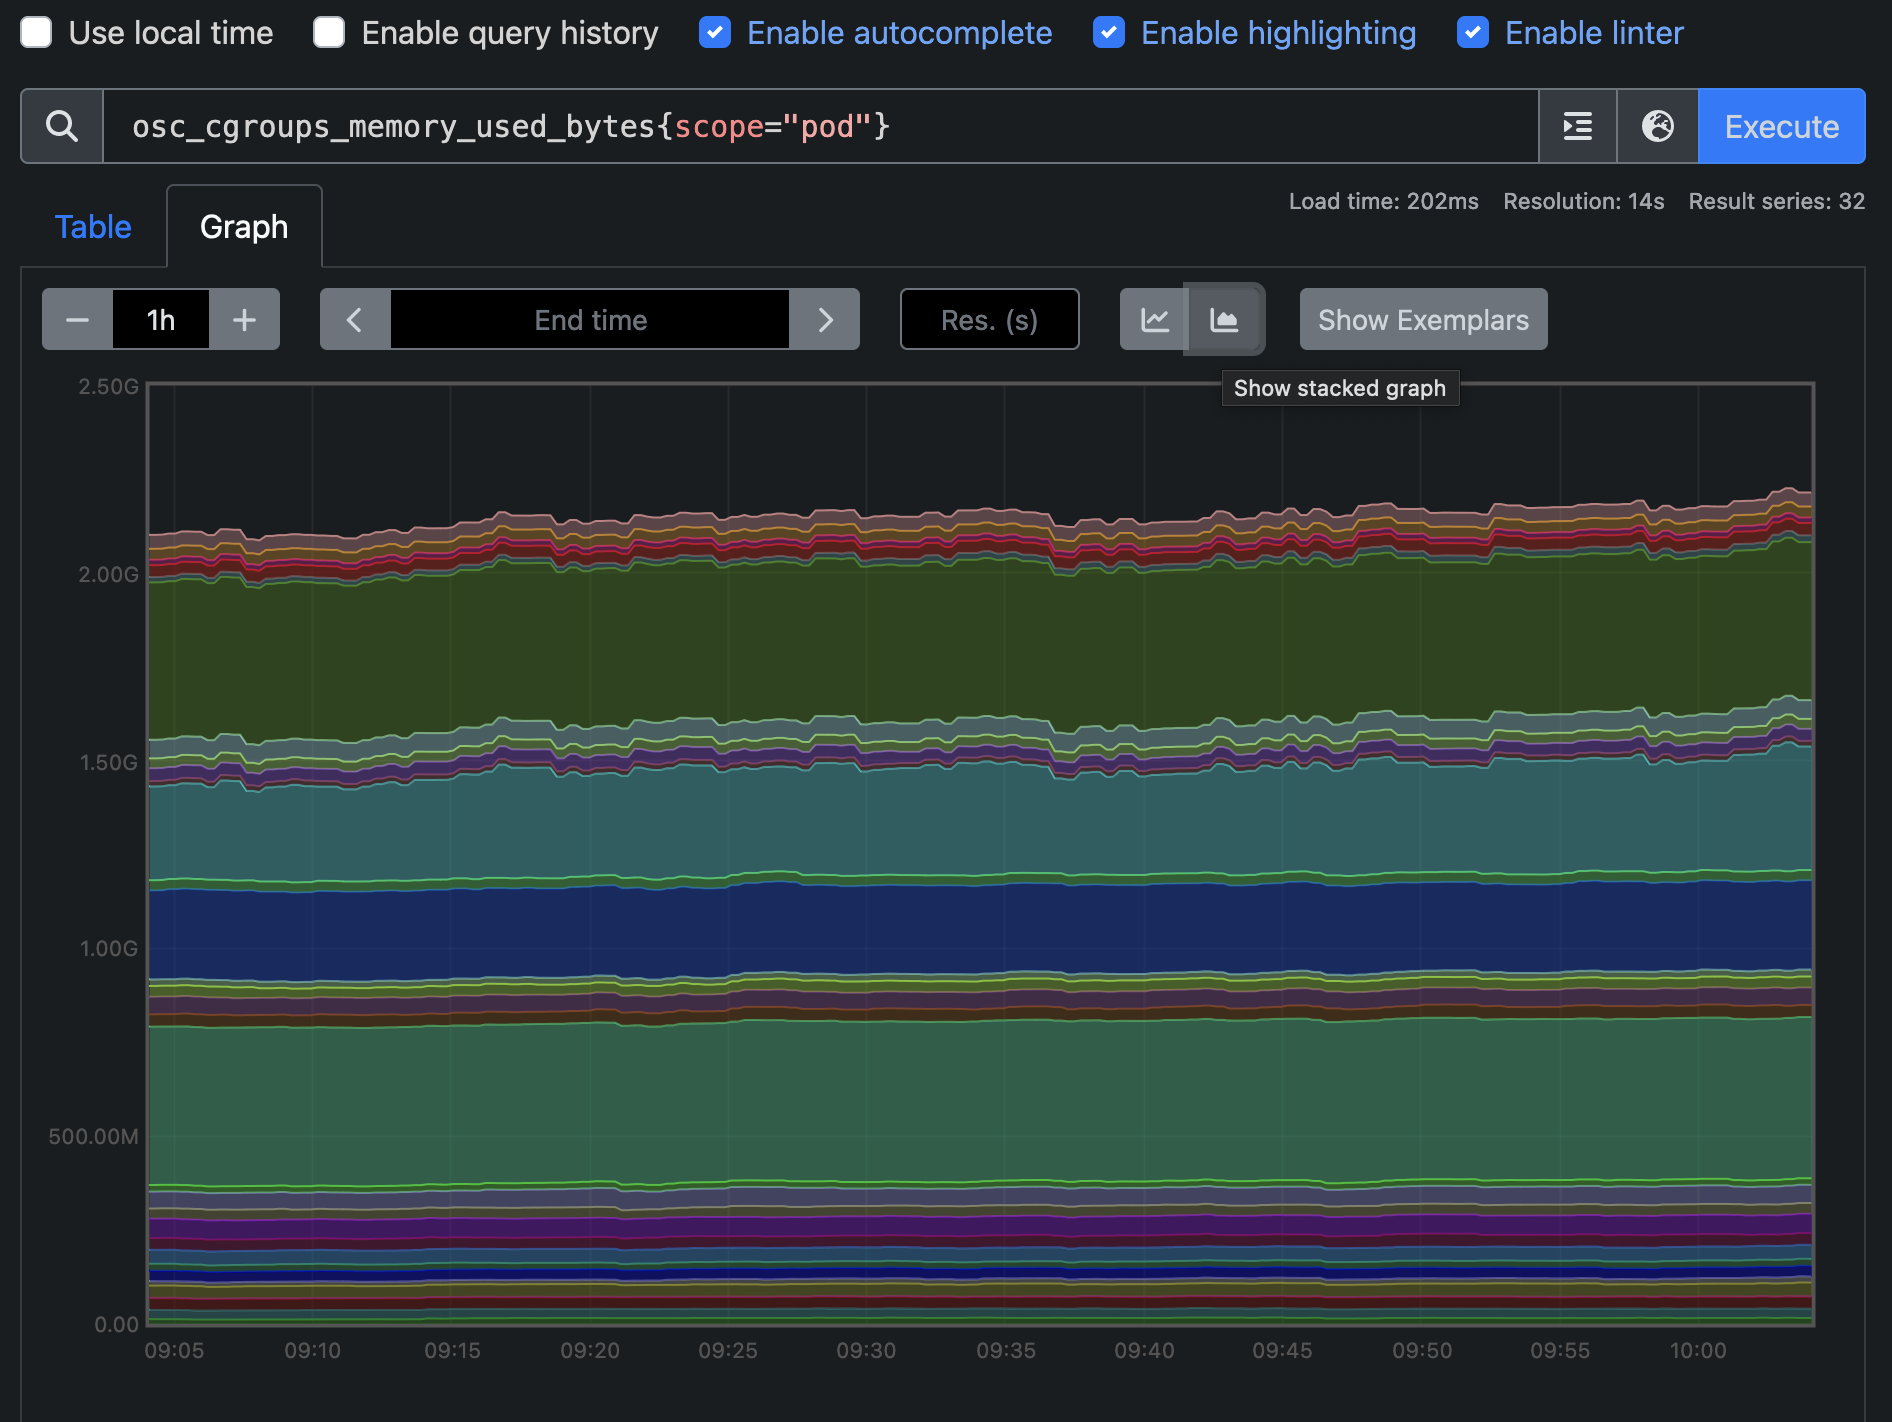
- metric
osc_cgroups_memory_used_bytes, scopepods: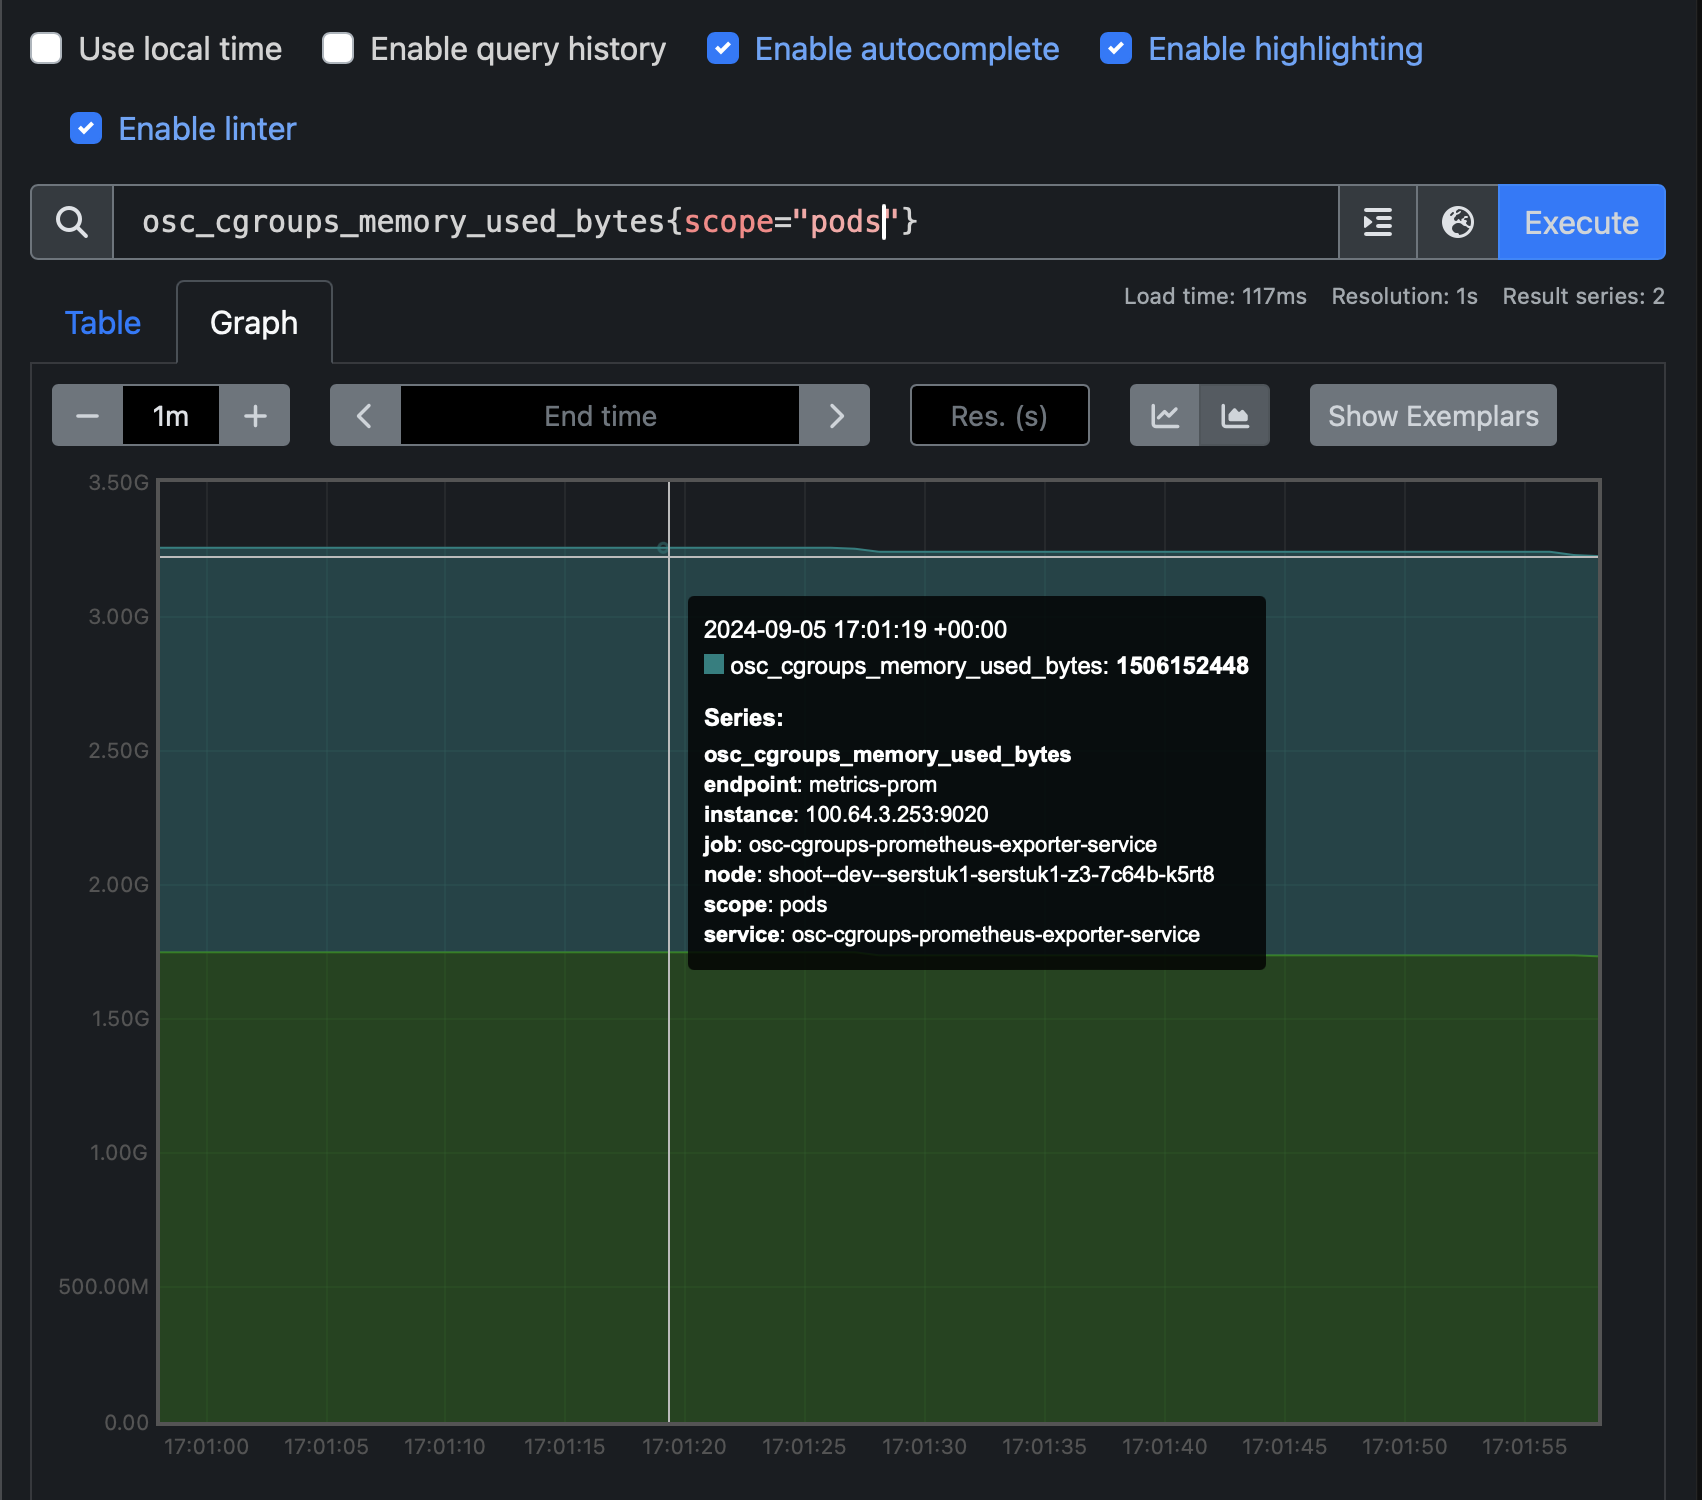
- metric
osc_cgroups_memory_used_bytes, scopeqos: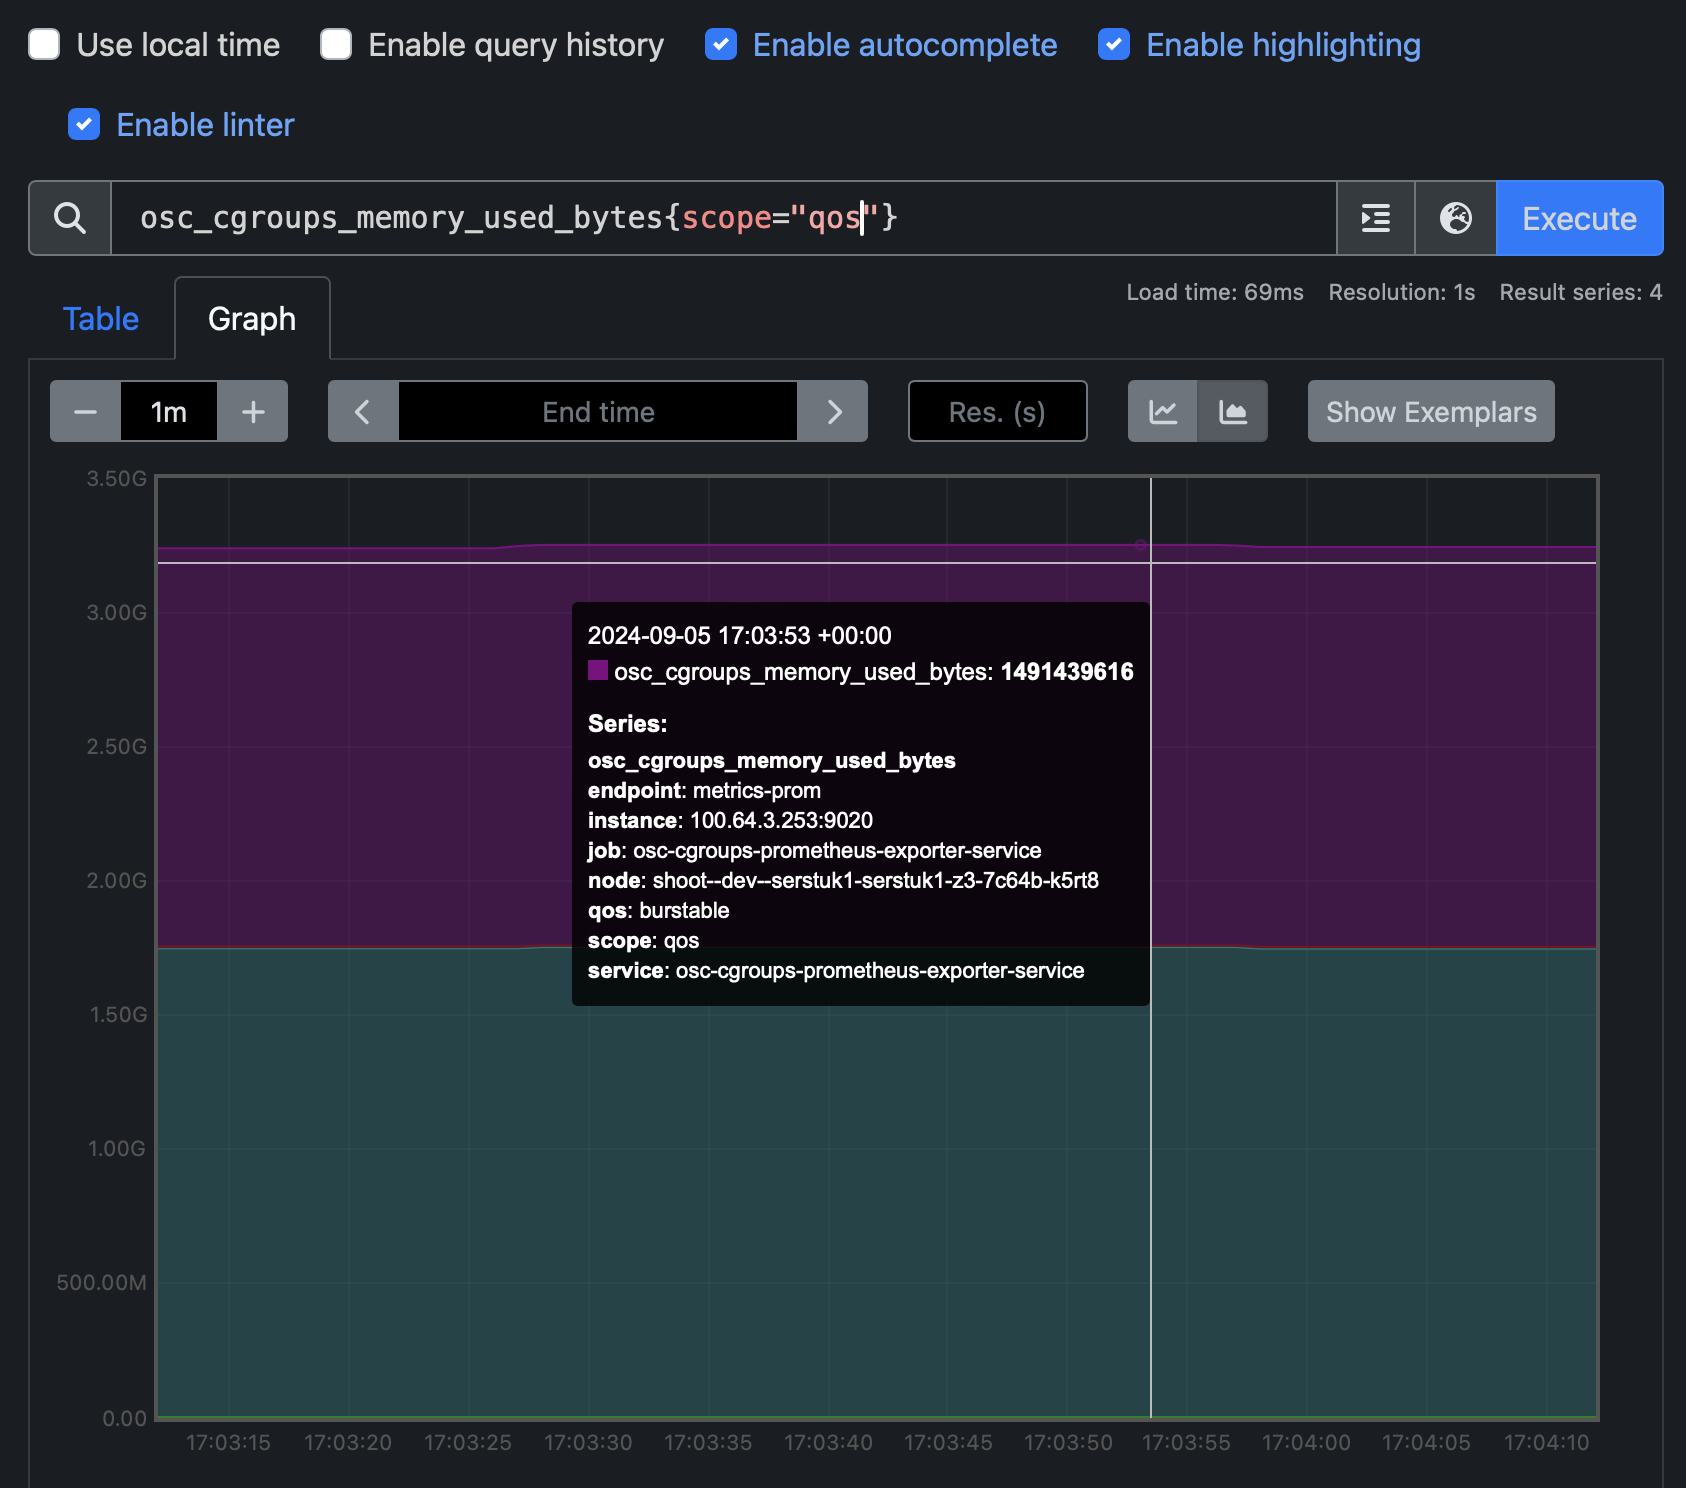
- metric
osc_cgroups_sgx_epc_used_bytes, scopecontainer: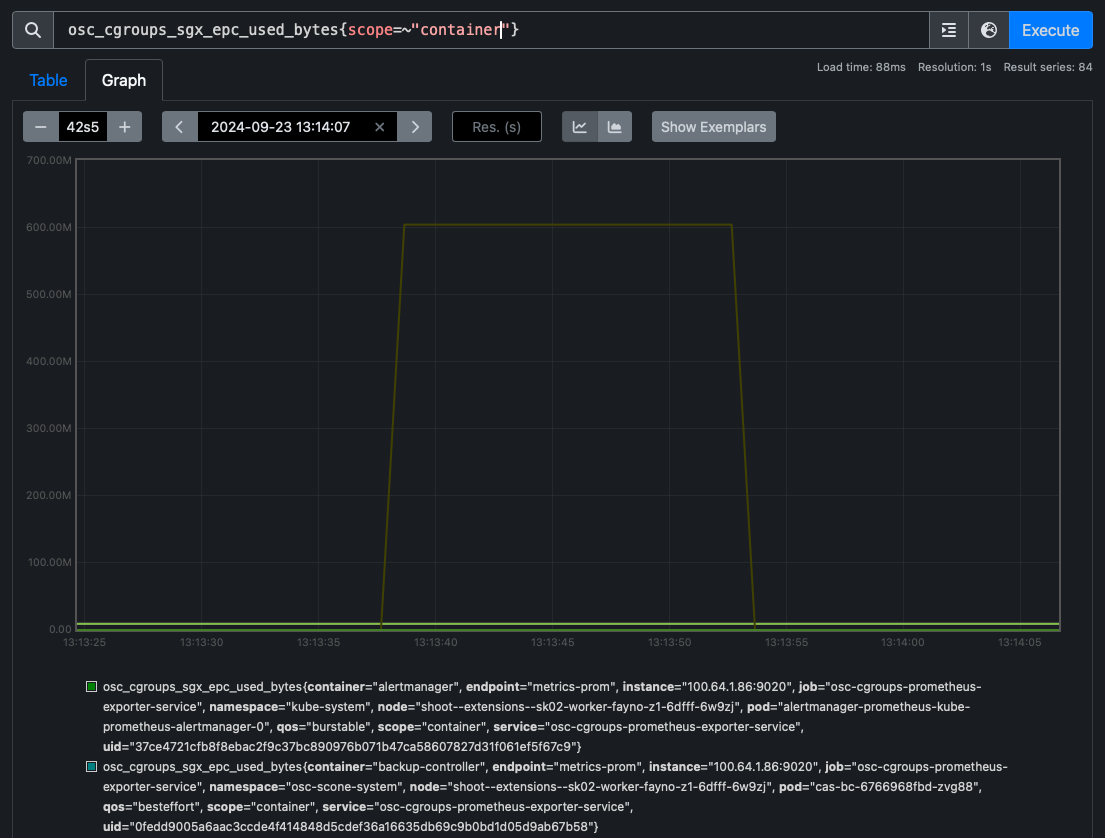
- metric
osc_cgroups_sgx_epc_limit_bytes, scopecontainer: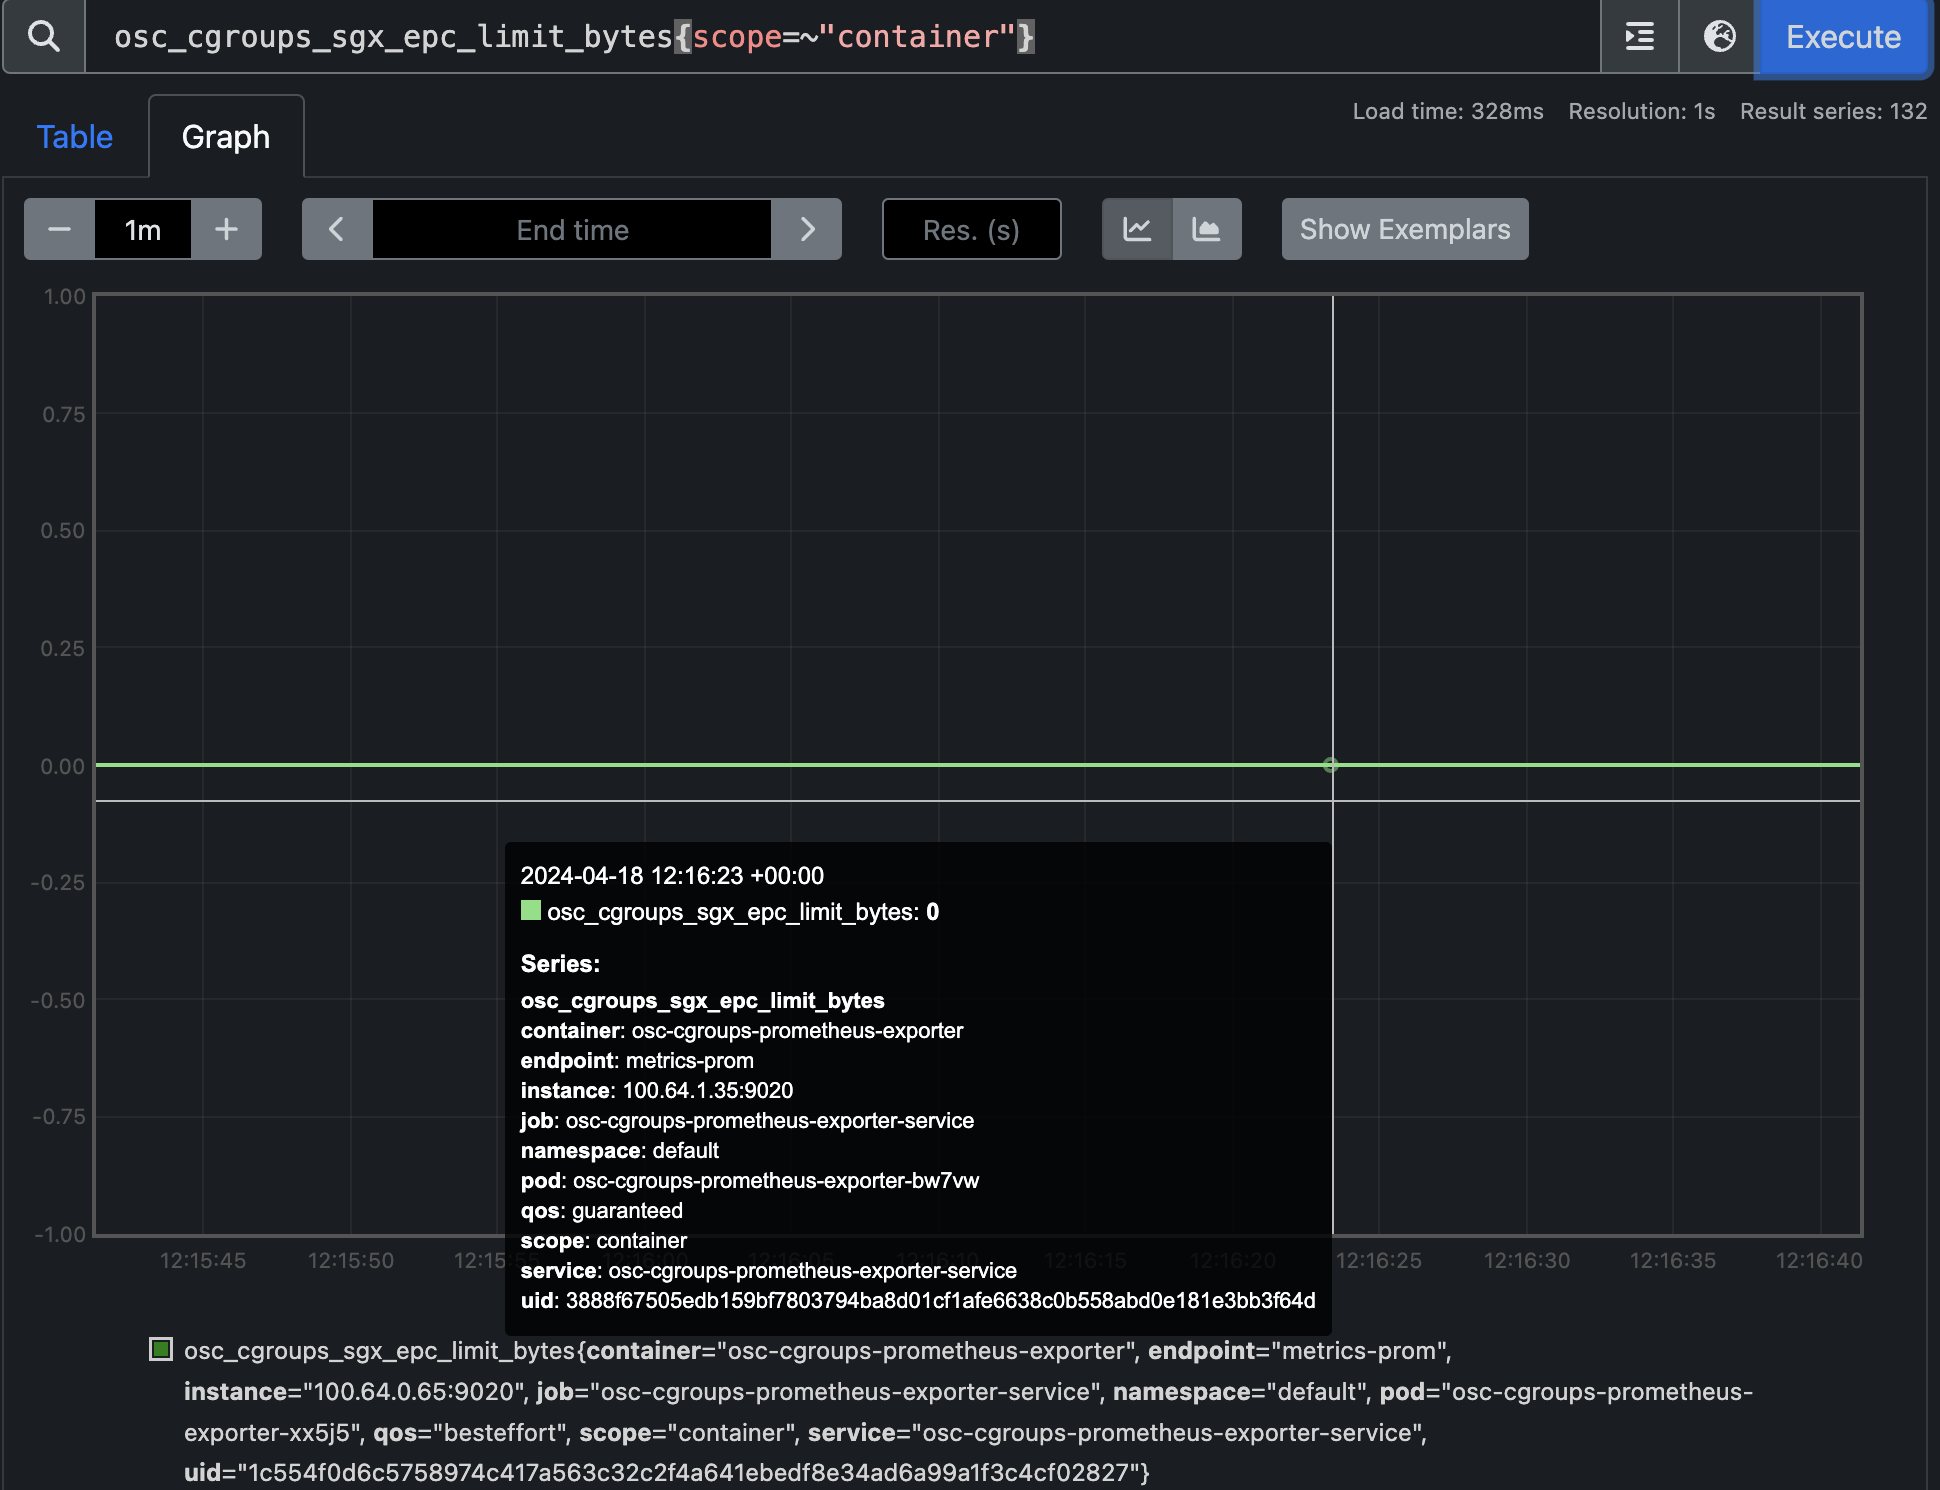
- metric
osc_cgroups_exporter_status: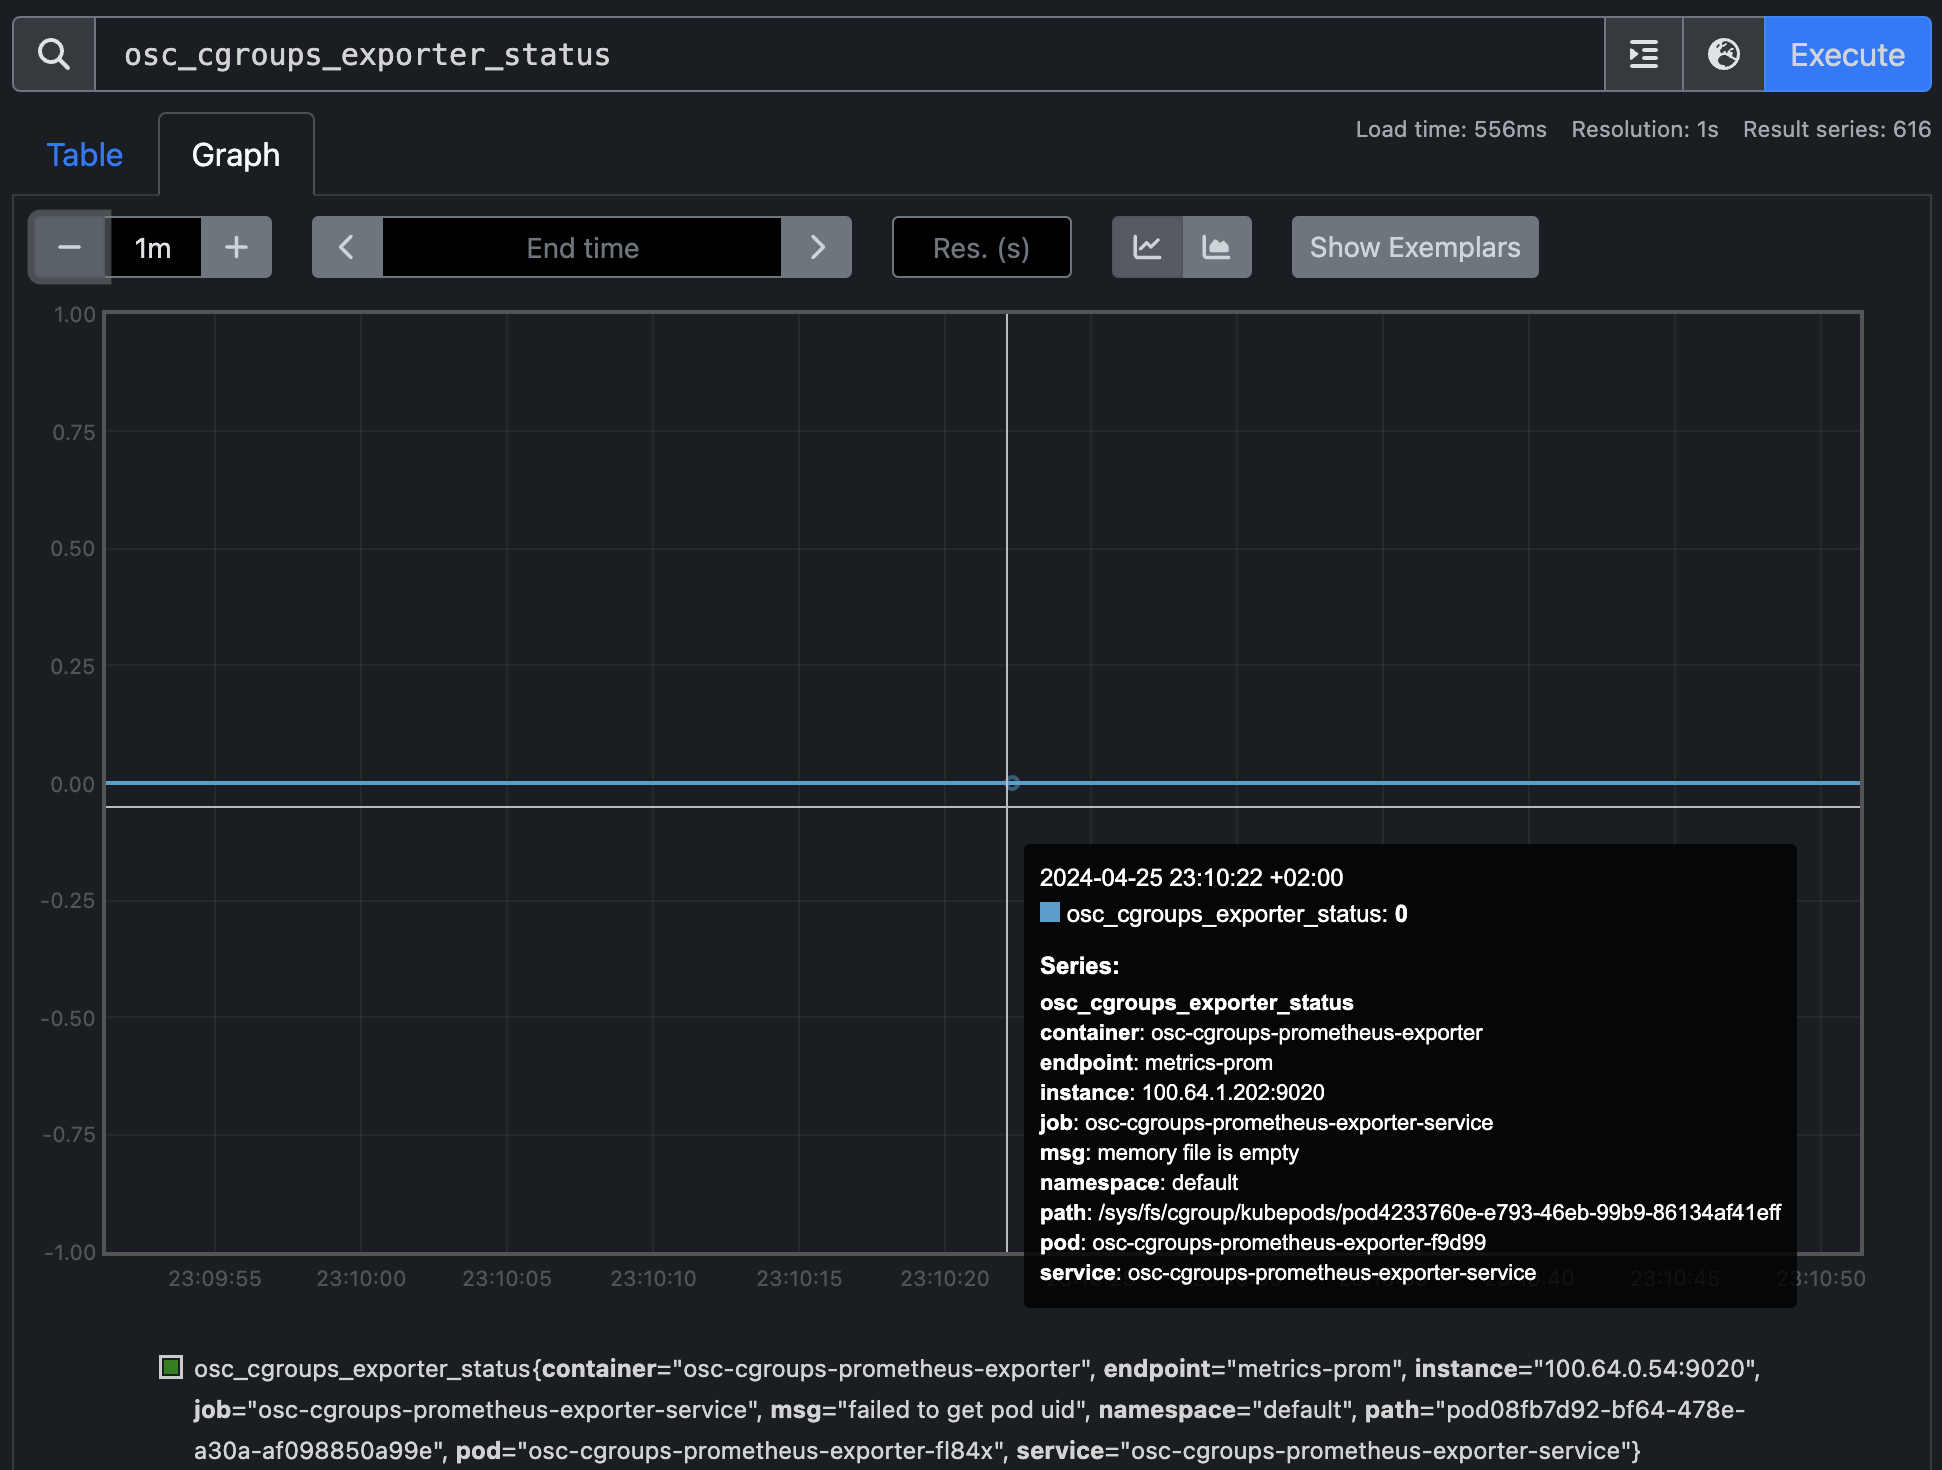
Node Feature Discovery
The Node Feature Discovery (NFD) extension provides the ability to modify values for Cgroups prometheus exporter. Here is an example of a Shoot YAML manifest:
kind: Shoot
apiVersion: core.gardener.cloud/v1beta1
metadata:
  name: …
  namespace: …
spec:
  extensions:
    - type: osc-nfd-shoot-service
      providerConfig:
        apiVersion: nfd.osc.extensions.config.gardener.cloud/v1alpha1
        kind: Configuration
        cgroups-prometheus-exporter:
          enabled: true
          values: |
            image:
              repository: mtr.devops.telekom.de/osc/common/monitoring/cgroups-prometheus-exporter
              tag: v0.2.1
              pullPolicy: Always
            prometheus:
              enablePrometheusRule: false
              enableServiceMonitor: true
        node-feature-rule:
          enabled: true
        node-feature-discovery:
          values: |
            image:
              repository:  mtr.devops.telekom.de/osc/gardener/node-feature-discovery
              pullPolicy: IfNotPresent
              tag: v0.13.4-minimal
          enabled: true
      disabled: false
   …
Support Matrix
The Cgroups prometheus exporter was tested in following configurations:
| Cgroups prometheus exporter version | Garden Linux version | Kubernetes version | Containerd version |
|---|---|---|---|
| v0.2.1 | 1510.0 | 1.26.8 | 1.7.11 |
| v0.2.1 | 1510.0 | 1.29.9 | 1.7.11 |
| v0.2.1 | 1605.0 | 1.28.14 | 1.7.20 |
| v0.2.1 | 1510.0 | 1.30.8 | 1.7.11 |
| v0.2.1 | 1510.0 | 1.31.4 | 1.7.11 |