Monitoring Physical Nodes (OSC Dashboard)
This guide explains how to use the Physical Nodes view of the OSC Dashboard to monitor the physical infrastructure your workloads are running on and how to interpret the metrics shown in the interface.
The view displays CPU and memory resources of the physical servers (nodes) in your infrastructure zones, including overcommit ratios, memory allocation breakdown, network and disk activity — and lets you drill down to see how the capacity of each physical node is consumed by the worker VMs of your Shoot clusters.
Info
The Physical Nodes view is only visible when infrastructure metrics are enabled for your OSC Dashboard installation. Infrastructure metrics are enabled by the OSC platform team; if you cannot see the tab, please contact OSC support.
Steps to Open the Physical Nodes View
- Log in to the OSC Dashboard.
- Open the Physical Nodes tab in one of three scopes:
- Main overview (all projects): select the Physical Nodes tab next to the Overview, Projects and Clusters tabs.
- Project scope: open a project and select the Physical Nodes tab in the Resources group of the project menu.
- Cluster scope: open a Shoot cluster and select the Physical Nodes tab next to the Cluster and YAML tabs.
- The Infrastructure Resources table opens, listing the physical nodes of the selected scope.
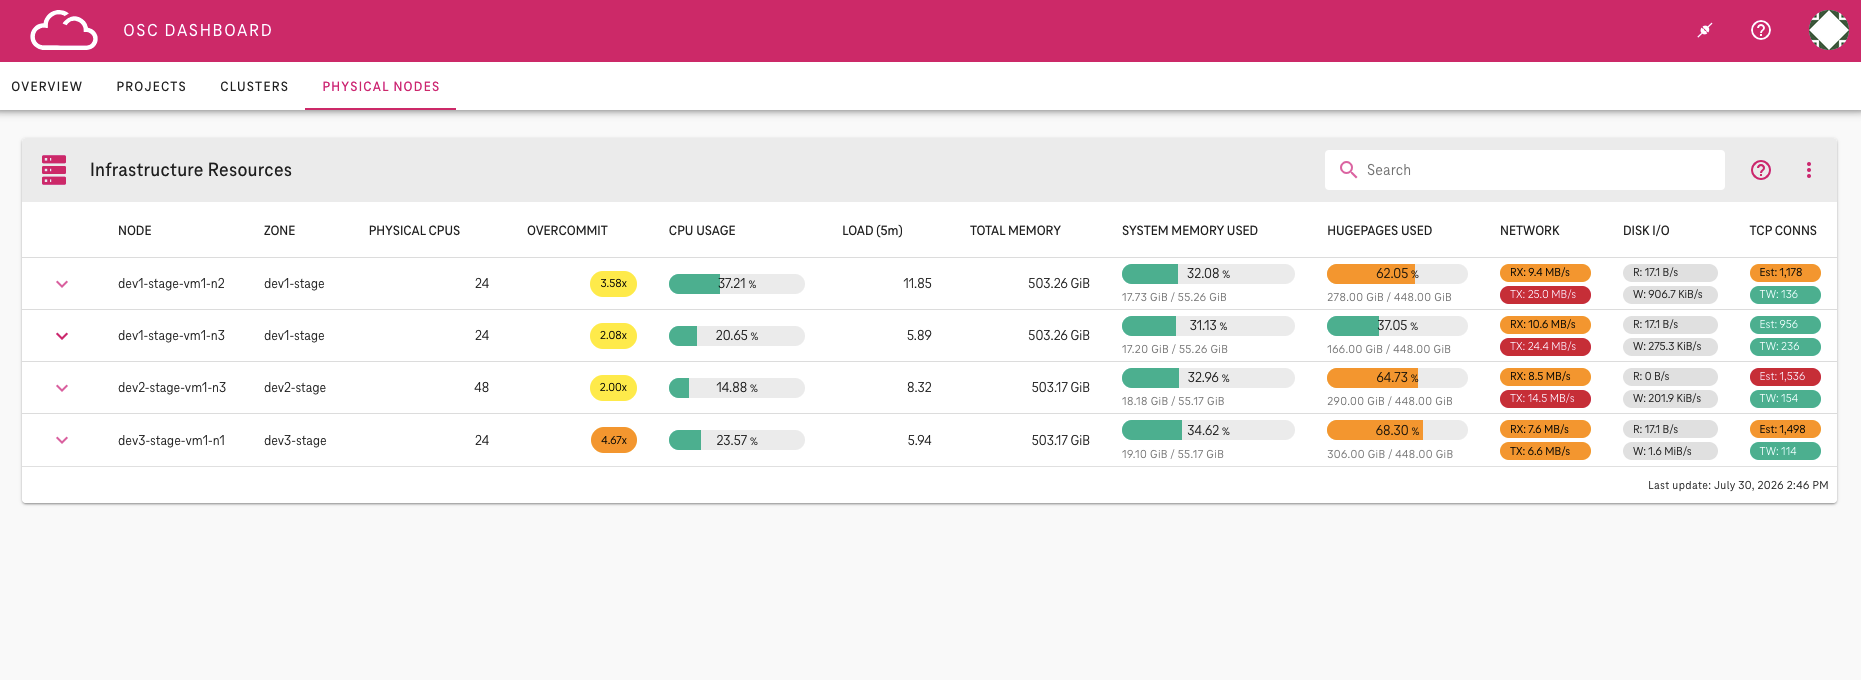
Physical Nodes view in the main overview scope. The view looks the same in all three scopes — only the set of displayed nodes and worker VMs differs.
Understanding the Overview Table
Each row of the table represents one physical server (node). The columns are organized in four groups:
Node Identity and Location
NODE: unique identifier of the physical server (node). Each node runs your workloads.ZONE: geographic or logical location where the server is deployed. Different zones provide redundancy and fault tolerance.
CPU Resources
PHYSICAL CPUS: number of physical CPU cores available in this node — the actual hardware CPU capacity.OVERCOMMIT: how efficiently CPU resources are shared. A ratio of2.0xmeans 2 virtual CPUs are allocated for every 1 physical CPU core. Hovering the chip displays the exact formula (allocated vCPUs / physical CPUs). Higher values indicate more sharing, which can affect performance during peak loads.CPU USAGE: percentage of CPU capacity currently being actively used. High values (> 85 %) may indicate the server is under heavy load. Sustained high usage on a physical node is handled by OSC operations; from the customer side, check the expanded worker VM view to see whether your clusters are contributing to the load.LOAD (5m): average number of processes waiting for CPU time over the last 5 minutes (load average). Values above the number of CPU cores indicate queuing and potential slowdowns.
Memory Resources
TOTAL MEMORY: total amount of RAM installed on the server.SYSTEM MEMORY USED: regular system memory (RAM) used by the operating system and background processes, not counting memory reserved for virtual machines. Shown as used versus total available system memory.HUGEPAGES USED: HugePages memory currently in use on this node. HugePages are reserved exclusively for virtual machine (VM) workloads, so this reflects the memory used by VMs, shown against the total HugePages capacity reserved on this node.SGX USED: amount of the node's secure memory (Intel SGX) currently in use. This is special hardware-protected memory for applications handling highly sensitive data; most workloads don't use it. This column is shown by default only when at least one node provides SGX memory.
Network and Disk Activity
NETWORK: data transfer rate.RXshows incoming data (download),TXshows outgoing data (upload).DISK I/O: storage read (R) and write (W) speed. High values indicate heavy database or file operations.TCP CONNS: number of active network connections.Estshows currently established connections,TWshows connections in the time-wait state (being closed). High numbers may indicate busy web services or potential connection leaks.
Built-in Help for Metrics and Columns
You do not need to remember all of the above — the descriptions are available directly in the OSC Dashboard.
Tooltip Details
Hovering any column header displays a tooltip with a short explanation of that metric. Tooltips are available in the overview table as well as in the expanded worker VM table.
Help Dialog
Clicking the question mark button in the top right corner of the view opens the Infrastructure Resources help dialog. It explains what the view shows and lists the description of every column, organized by the groups above.
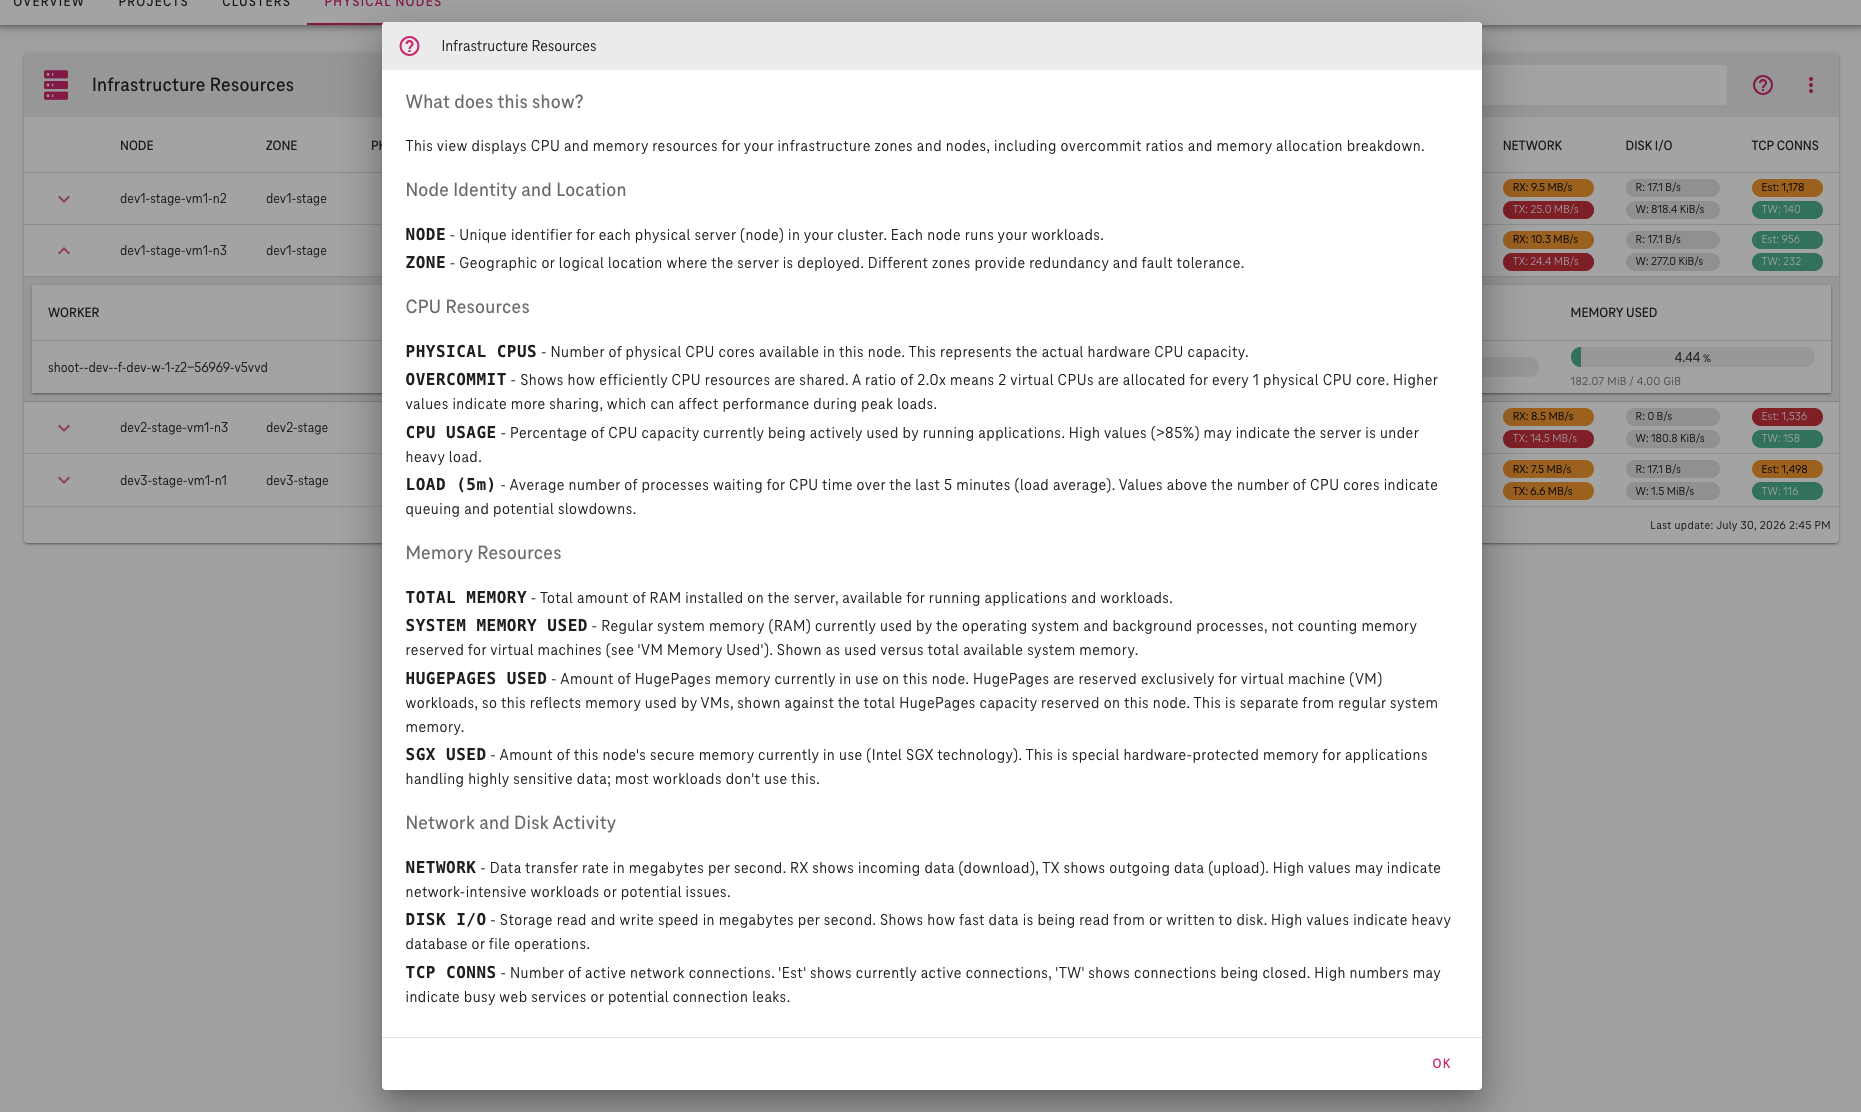
The help dialog opened via the question mark button.
Showing Consumption by Shoot Clusters
Every node row can be expanded using the chevron at the beginning of the row. The expanded section lists the worker VMs running on this physical node, so you can see exactly how the node's capacity is consumed by your Shoot clusters:
WORKER: worker VM instance identifier. The name includes the worker group, zone and a unique ID.PROJECT: project the worker VM belongs to (shown in the main overview scope). Click it to open that project's Physical Nodes view.CLUSTER: Shoot cluster the worker VM belongs to. Click it to open the Physical Nodes view of that cluster.INSTANCE TYPE: machine class / instance type of the VM, defining its hardware profile (vCPUs, memory).VCPUS: number of virtual CPU cores assigned to the VM.CPU USAGE: percentage of the allocated CPU cores currently in use. High values (> 80 %) indicate the VM may need more CPU capacity.MEMORY USED: memory used inside the virtual machine itself, as reported by the VM.
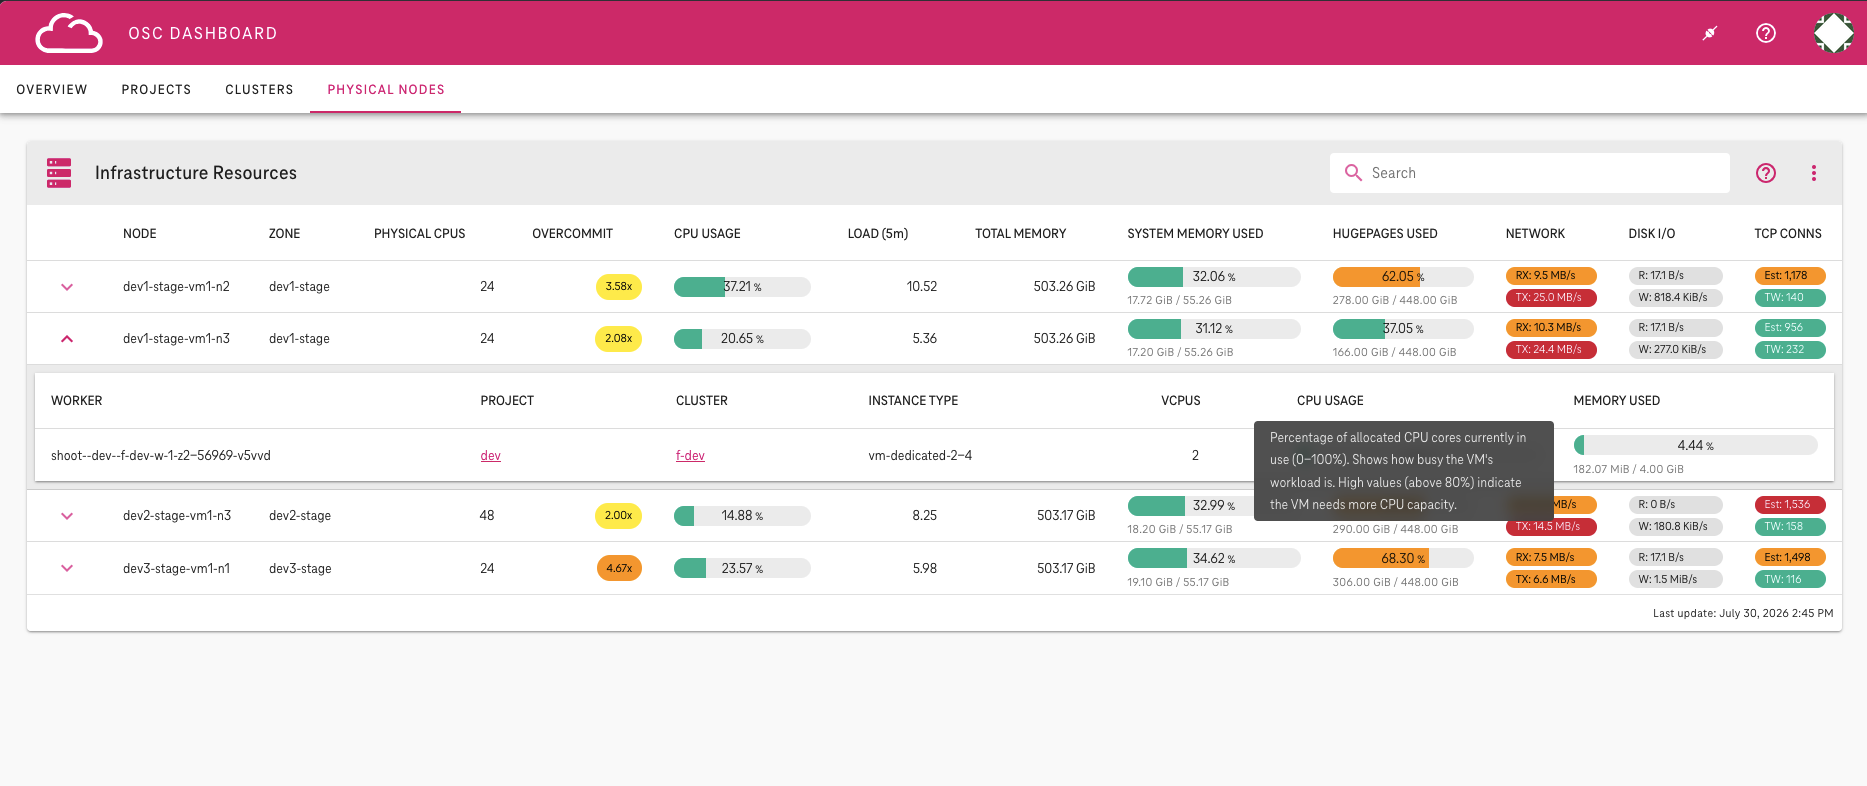
Expanded node row with the worker VM table.
A column header tooltip is shown for the CPU USAGE column.
Tip
The PROJECT and CLUSTER values are links —
use them to quickly jump from a physical node
to the Physical Nodes view of the project or cluster
that is consuming its resources.
Customizing the View
Search: use the search field in the toolbar to filter nodes by name, zone, or any visible column value.- Sorting: click a column header to sort the table by that column.
- Column selection: use the column selection button in the toolbar to show or hide individual columns. Your selection is remembered by the browser.
Data Freshness
The metrics are refreshed automatically every minute.
The Last update timestamp in the bottom right corner of the view
shows when the data was last retrieved.
While new data is being loaded, a small progress indicator is displayed;
if the last refresh failed, a warning icon appears instead.
Note
For a Shoot cluster that is hibernated, no resource metrics are available. Wake up the cluster to view its resource information.
Related Documentation
- Monitoring options overview: Monitoring Resource Capacity
- SGX memory monitoring: Monitoring SGX Memory
- Worker pool configuration: Worker pool management